Interim Report after 12 Months Follow-up
March 2018
Executive Summary
Following guidance from the US President’s Malaria Initiative (PMI), durability monitoring of two brands of Long-lasting Insecticidal Nets (LLIN) (Duranet and DAWA Plus 2.0) distributed in two 2016 mass distribution campaigns in DRC was set up in two health zones of two neighboring and ecologically similar provinces, namely Sud Ubangi and Mongala. The durability monitoring was carried out by the National and Provincial Malaria Control Programs and the Kinshasa School of Public Health with support from the VectorWorks project and PMI.
This report summarizes the results to date after the 12-months follow-up survey which was carried out in August 2017.
House and net follow-up
Tracking down the households recruited at baseline generally went very well with 89% of the 120 households interviewed in Sud Ubangi and 85% of 120 located in Mongala. In Sud Ubangi four households were lost as the family moved away and nine households (8%) were temporarily unavailable, but will be included in the next survey round. In Mongala 12 households were not found for interview but the details of the reasons were not recorded. Of the campaign nets labeled for the durability monitoring cohort 328 (87%) are still active in Sud Ubangi and 286 (76%) in Mongala. These rates of follow-up can be considered as excellent and within the expected.
Durability risk factors
Overall the durability risk factors based on sleeping place environment, net handling and household knowledge and attitudes were very similar to what had been found at baseline, but with some differences between the two sites. Net handling was poor. At both sites nets are always left hanging loose during the day when they were hanging at all. Net washing risks were moderate, nets were not dried on fence or bushes, and there was not significant use of detergent. BCC exposure was not very high at both sites, but had declined since the baseline or rather the campaign and consisted predominantly of inter-personal communication. However, recall of messages was better in Sud Ubangi than Mongala, and although recall declined somewhat, the proportion of households with a very positive net care and repair attitude had increased from baseline and was significantly better in Sud Ubangi than Mongala (69% vs. 28%).
Net use and ownership
At baseline – two months after distribution – there had been some concerns that the majority of campaign cohort nets were found still in the package (43% in Sud Ubangi and 71% in Mongala). Ten months later, i.e. one year after distribution the situation had changed significantly with only 14% and 33% of cohort nets still in the package, 78% and 54% respectively hanging, and 77% and 54% used the previous night. On the other hand, nets from other sources were now used less, especially in Sud Ubangi where nets obtained since the campaign were now more likely to be kept in the package. There was some evidence of between-household shift of nets as 22% and 20% respectively had nets from “relatives or friends” and this rate had increased from baseline. In Sud Ubangi 42% of households had received additional nets since the campaign and half came from public sector distribution while in Mongala the rate was 33% and slightly more than half coming from the public sector.
Integrity outcomes
After one year about half of the campaign nets still found in the homes and inspected for damage were found to have any holes (61% Sud Ubangi, 46% Mongala). Although the rate of any holes was lower in Mongala, the level of damage was higher with 20% of surviving nets being too torn compared to only 10% in Sud Ubangi. In line with this finding there also was a statistically significant difference in the rate of attrition due to wear and tear which was 1.2% in Sud Ubangi, but 10.1% in Mongala. Although some caution has to be applied when projecting the expected median survival time at this early stage, the median expected survival of campaign nets in Sud Ubangi is 2.4 years and just 1.5 years in Mongala. Both results are below the expected three year survival estimate and the difference between the sites is also statistically significant. Although the design of this study is primarily to compare two different brands in similar environments, the observed difference cannot entirely be attributed to the brands as at the better performing site (Sud Ubangi) there also was a significantly better net care and repair attitude.
Insecticidal effectiveness
The insecticidal effectiveness was good at both sites with 83% (Sud Ubangi) and 100% (Mongala) of tested samples fulfilling WHOPES criteria of optimal insecticidal performance. Results for the Duranet in Sud Ubangi were slightly but not statistically significantly lower than Dawa Plus 2.0 in Mongala. The nets sampled for bio-assays were comparable to the cohort nets with respect to handling and washing.
In conclusion it can be said that the follow-up of the durability monitoring cohort in Sud Ubangi and Mongala was successful but that the results for the physical durability are slightly below the expected range in Sud Ubangi (Duranet), and significantly below the “three year” standard in Mongala (Dawa Plus). The difference was in a higher proportion of campaign nets in Mongala lost to wear and tear as well as a poorer condition of the surviving nets. The evidence to date suggests that the poorer performance of the LLIN product in Mongala could in part be due to differences in the textile characteristics of the brands tested under generally harsh and difficult conditions, but that some behavioral differences in attitude between the sites also contributed to the observed difference in performance. At this point there is no immediate recommendation to be made regarding net procurement, but it can be recommended to enhance net care and increase related BCC, especially in Mongala Province.
The insecticidal effectiveness of both LLIN products was within expectations after 12 months with > 80% of samples fulfilling WHOPES criteria.
1 Table of Contents
5.2 Determinants of Durability. 14
5.4 Durability of campaign nets. 20
5.5 Insecticidal effectiveness of campaign nets. 26
2 Acknowledgements
This work is made possible by the generous support of the American people through the United States Agency for International Development (USAID) and the President’s Malaria Initiative under the terms of USAID/JHU Cooperative Agreement No: AID-OAA-A-14-00057. The contents do not necessarily reflect the views of USAID, PMI or the United States Government.
3 Background
Malaria prevention with long-lasting insecticidal mosquito nets (LLIN) has seen a tremendous scale-up in sub-Saharan Africa in recent years. Many countries have achieved high ownership coverage with ITN and are approaching the universal coverage target of one net for every two people of the population at risk as recommended by the World Health Organization (WHO). A critical question now is how these successes can be sustained. In this context it is important to understand how long distributed ITN remain in the households and continue to protect the net users. This information is needed to decide when the ITN needs to be replaced and also to select the best product for a specific environment.
Net durability has two components, the physical durability and the insecticidal durability or effectiveness. Physical durability in turn comprises of the loss of nets due to wear and tear and the physical integrity of surviving nets. Over the last five years the methodology on how to measure net durability has made significant progress and now comprehensive guidance is available from WHO, resulting in the recommendation that all malaria control programs that distribute ITN should also routinely monitor net durability. Donors such as the President’s Malaria Initiative (PMI) and implementing partners have taken up this recommendation and also encourage routine monitoring of ITN durability in the countries they support.
To date few studies have been published that used the new methodology to measure the field performance of specific ITN brands, compare different products in the same area or the same product in different environments. In Western Uganda the polyester ITN brand Interceptor was followed-up for 3.5 years with 20% of nets lost during the study period, 87% of surviving nets still in acceptable or serviceable condition and 71% with optimal insecticidal effectiveness[1]. The study concluded that this ITN had a median functional survival of three and a half years.
In the DRC some anecdotal reports from the field have suggested that the average survival of ITN under operational conditions may be less than three years. To date, only one study has been conducted in this area (Mansiangi et al, unpublished). The study was carried out in 2015 in eight provinces, with both a retrospective design for the survival aspects of ITN and a cross-sectional one for aspects related to the use of LLINs in households. The time elapsed since the distribution of nets (mainly Permanet 2.0) was between 5 and 44 months. Attrition and physical integrity were both measured. The results suggest that in only two of the eight provinces, median survival of the Permanet 2.0 in serviceable conditions was between 2.5 and 3.0 years, while for the other provinces it was between 1.5 and 2.0 years. However, the sample included only households with children under five years of age and this may have caused a slight underestimation of survival. Indeed, previous studies have shown that in some cultural environments, the durability of nets is low in households with young children[2].
In 2015/16 the DRC’s National Malaria Control Program (NMCP) with the support of its partners launched a mass campaign in the Northern Provinces as part of the ongoing “rolling” system of provincial LLIN distributions to maintain universal coverage with ITN where multiple brands of ITN were distributed. With the current durability monitoring exercise, the NMCP would like to better understand the performance comparison of two of these brands in areas with similar ecologic and socio-demographic conditions.
4 Methods
4.1 Sites
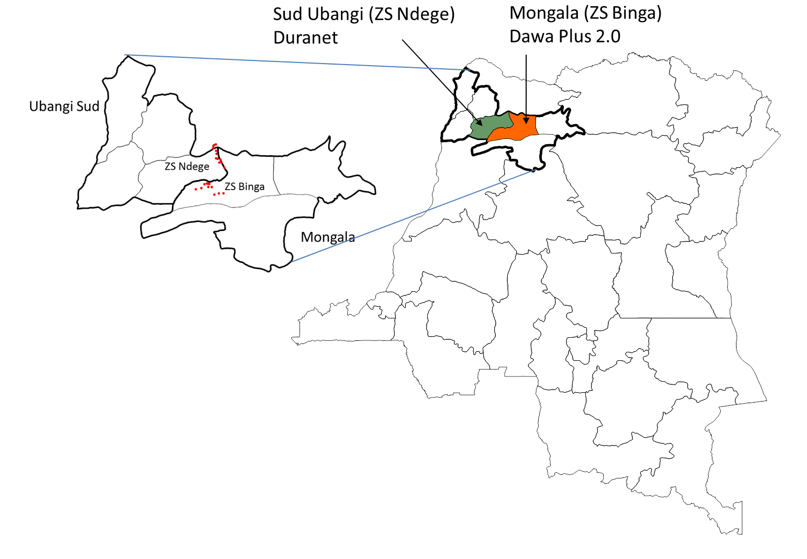
Two neighboring sites, Sud Ubangi and Mongala Provinces were selected in the former Equateur Province, situated in the rainforest zone in Northwest DRC. One health zone (HZ) in each was selected: Ndage HZ for Sud Ubangi and Binga HZ for Mongala. The locations are shown in Figure 1 below and can be briefly describes as follows:
The climate is equatorial (warm and humid), with a bimodal rain pattern: The rainy season usually last 9 months starting from March to November. The dry season starts from December to March, and three weeks in the month of July. The vegetation is dominated by the equatorial forest with clay-sandy soil. The hydrography of the area is composed of three large rivers: the Congo River, the Mongala River, and the Sambo River. The tributaries of these rivers intersect the HZs thus making access difficult for some places, especially during the rainy season.
In general, agriculture, hunting, fishing and small trade are the main occupations of the population. Livestock production is moderately frequent and mainly concerns small livestock and poultry. In addition, there are a number of large agricultural companies active such as the Société des Cultures au Congo which is the main employer in the Binga HZ. It specializes in the production of palm oil, rubber and cocoa. It employs about 30% of the labor force available in this HZ. It is thanks to the presence of this company that the HZ has telecommunication coverage at least in some areas.
Malaria is the most dominant disease in terms of morbidity and mortality with perennial transmission and hyper- to holoendemic endemicity. Based on estimates from the Malaria in Africa project, Plasmodium falciparum prevalence among children 2-10 years is around 60%. Other diseases with high morbidity are waterborne diseases, acute respiratory infections, and protein-energy malnutrition. Table 1 presents some of the key indicators from the 2013-14 Demographic and Health Survey (DHS).
Table 1: Socio-demographic and malaria situation in the study areas (2013/14); HH=household
| Province | Under-fives with fever receiving diagnostic test | Under-fives with positive malaria RDT | Febrile children treated with antimalarial | HH with at least one LLIN | Population using ITN last night |
| Sud Ubangi | 15 % | 25 % | 35 % | 89 % | 63 % |
| Mongala | 7 % | 24 % | 25 % | 88 % | 66 % |
The main ethnic group in the area is the Ngombe and the main spoken languages are Lingala and Lingombe.
The Binga HZ is subdivided into 30 health areas (HAs) of which 28 are accessible by roads in very bad condition and two are accessible only by river. The Ndage HZ is subdivided into 18 HAs.
Figure 1: Site map with GPS points of selected clusters
4.2 Brands monitored
The two brands of ITN being monitored are:
DAWA Plus 2.0, 100 denier polyester ITN in white color. The ITN uses coating technology with a loading dose of 80 mg/m2 of deltamethrin. DAWA Plus 2.0 received interim WHOPES recommendation in July 2009 (13th WHOPES Report).
Duranet, a 145 denier polyethylene ITN in blue color uses incorporation technology with a loading dose of 260 mg/m2 of alphacypermethrin. Duranet received full WHOPES recommendation in July 2013 (17th WHOPES Report).
4.2.1 Preshipment testing
All LLINs procured with public funds from the major donors (The Global Fund, PMI, UNICEF etc.) undergo pre-shipment quality control. This includes all parameters defined in the specifications issued by the WHO Pesticide Evaluation Scheme (WHOPES), namely textile features (grams per square meter, bursting strength) and insecticide content. Pre-shipment quality assurance data is available from the procurer from August 2015 for one of the brands, Dawa Plus (document references PUP-2136 to 2145) and at this point chemical content of the Dawa Plus samples was according to specifications. No pre-shipment data is currently available for the Duranet LLIN.
4.3 Design summary
The design follows in general the guidance of PMI for ITN durability monitoring (see www.durabilitymonitoring.org ). Within six months following the mass distribution campaign a representative cohort of campaign ITN are sampled and labeled in each selected site and then followed up after 12, 24, and 36 months. At each time point, measures of physical durability are assessed (attrition and integrity). Except at baseline, samples are taken for assessment of insecticidal effectiveness (bio-assay) and analyzed at the entomology laboratory of the Institute of Bio-Medical Research (INRB) in Kinshasa. At the 12- and 24-month surveys the samples are taken from households not part of the cohort (nearest neighbor) and from the cohort at 36-month follow-up and all nets collected for bio-assay are replaced with new LLINs. In the case of DRC two similar sites with two different types of ITN brand have been selected so that this durability study compares two brands in areas with very similar ecological and/or behavioral characteristics.
The sample size follows PMI guidance with 150 households per site (15 clusters with 10 households each) and an expected number of 345 campaign nets labeled for follow-up. This sample size is targeted at detecting a deviation of 18%-points from the expected 50% survival after three years comparing the best and the poorest performing site or brand. Using the standard formula for sample size calculations for comparing proportions in two groups with the above outlined settings results in a sample of 147 ITN per study site after three years. After applying the expected design effect of 2.0 and loss to follow-up of households of 5%, the required sample after three years is 279 per site. Taking into account that the expected attrition rates in a sample of 345 ITN has to be taken at baseline and based on the expected number of ITN distributed per household, 150 households need to be sampled per site.
At baseline, the ITN cohort in each HZ was established by selecting a representative sample of clusters (communities) based on probability proportionate to size after inaccessible communities had been eliminated from the sampling frame and households using simple random sampling from household lists established on the day of the survey. As soon as clusters were sampled, the local authorities and chiefs were informed of the purpose and expected time of the survey and their support sought. Communities were then sensitized and mobilized in order to obtain maximum cooperation for the surveys. All ITN received from the NMCP campaign by the selected households were identified and marked with a unique ID number. The physical condition of campaign nets was measured through a hole assessment and a household interview was undertaken.
The ITN mass distribution campaigns took place August 12-16 2016 in Sud Ubangi implemented by UNICEF and funded by PMI, and August 25-28 2016 for Mongala implemented by PSI with Global Fund funding. Baseline assessments took place October 19-24 2016 in Sud Ubangi and October 27-31, 2016 for Mongala while the 12 months data collection was carried out 12-17 August and 22-27 August 2017 respectively.
4.4 Field work
An implementation team of nine individuals was established per site for each of the survey rounds, with one overall site coordinator and two field teams each consisting of one supervisor and three interviewers. Activities in the field were overseen by staff of the Kinshasa School of Public Health. Interviewers and supervisors were carefully selected so that they were culturally acceptable, had good knowledge of the local languages and experience in conducting household surveys. All but one interviewer and all supervisors for the 12-month survey had already participated in the baseline surveys.
Prior to the fieldwork, a three-day refresher training was held, which included the following components:
- Understanding the study design and sampling procedures
- General approach to ethics of field work (consent and interview)
- Detailed study of interview with role play
- Introduction to and practice using the data entry device
- Labeling of the campaign cohort nets
- Physical assessment of holes and repairs in nets with practical exercises
- Collection of sample campaign nets for bio-assays and issue of replacement nets
The training for each site took place immediately before the field work.
4.5 Data management
For data collection, android-based tablets PCs were used and installed with the data collection software, Open Data Kit (ODK), a free and open-source mobile data collection tool. Each field team was provided with a tablet for the household interviews and net hole counting; data from each interviewer was collected and directly uploaded to a Dropbox folder (if internet was available) or collected on a local storage device (laptop) by the supervisor until it could be transferred. Data was then checked and verified by the co-investigator before it was deleted from the tablets, and any inconsistencies followed up the following day. From the data, three types of data files were created and updated after each assessment round:
- The household files
- The campaign (cohort) net files
- The files for other nets owned by the households
4.6 Analysis
Data was converted from the ODK system to comma-delimited data files (*.csv format) using the ODK briefcase tool for daily inspection of incoming data. After completion of the survey, datasets were transferred to Stata version 14.2 (Stata, Texas, USA) for further aggregation, consistency checks and preparation for analysis. Stata do-files (macros) developed by the VectorWorks project were applied and adjusted as needed (see www.durabilitymonitoring.org).
For continuous variables, arithmetic means were used to describe the central tendency and the t-test for comparison of groups for normally distributed data. Otherwise, median and non-parametric tests were used. Proportions were compared by contingency tables and the Chi-squared test used to test for differences in proportions. For calculation of confidence intervals around estimates, the intra- and between-cluster correlation has been taken into account.
Overall household attitudes towards nets and care and repair were measured using a set of Likert score questions where a statement is read to the respondent and the level of agreement recorded; these are analyzed by recoding the four-level Likert scale score to have a value of -2 for “strongly disagree”, -1 for “disagree”, +1 for “agree” and +2 for “strongly agree.” These attitude scores for each respondent were then summed and divided by the number of statements to calculate an overall attitude score for which 0 represents a neutral result and positive values a positive result. For each site proportion of households with a score above 1 (very positive attitude) were calculated. Two attitude scores were used, one for general attitude towards net use and one specifically for care and repair.
A wealth index was calculated for the baseline data set using the basic household assets and using a principal component analysis with the first component used as the index. Households were then grouped into tertiles. The full household data collection will be repeated at the 36-month survey. However, at the 12- and 24-month-surveys no specific household or member data is collected.
Net integrity was measured first by the proportionate Hole Index (pHI) as recommended by WHO. Holes were counted in the field using hole size templates (visual aids) and using a tally sheet for counting or a tablet based application. Holes were categorized into four different sizes: size 1: 0.5-2 cm, size 2: 2-10cm, size 3: 10-25 cm and size 4: larger than 25 cm in diameter. The proportionate Hole Index (pHI) for each net will be calculated in the following way:
pHI= # size 1 holes + (# size 2 holes x 23) + (# size 3 holes x 196) + (# size 4 holes x 576)
Based on the pHI each net is then categorized as “good”, “serviceable” or “ torn” as follows [2, 3]:
Good: total hole surface area <0.01m² or pHI<64
Serviceable: total hole surface area <=0.1 m² or pHI<=642
Torn: total hole surface area>0.1m² or pHI>642
The outcomes of insecticidal effectiveness were based on the bio-assay results using the standard WHO cone test performed at the National Institute for Biomedical Research. A pyrethroid-sensitive Kisumu strain of Anopheles gambiae s.s. was used with 5 mosquitoes per cone, five sites tested on each net (4 sides and roof) and one replicate per location (5 cone tests with 25 mosquitoes per net in total). The 60 minute knock-down and the 24 hour mortality rate were recorded. The two variables from these tests, 60-minute knock-down rate and 24-hour mortality rate, were combined into the following outcome measures:
Optimal effectiveness: KD60 ≥ 95% or functional mortality ≥ 80%
Minimal effectiveness: KD60 ≥ 75% or functional mortality ≥ 50%
4.7 Ethical Clearance
Ethical clearance was obtained from the Institutional Review Board of the Johns Hopkins University, Baltimore, USA (IRB No.: 7184) and the Ethics Committee of The School of Public Health, University of Kinshasa, DRC (ESP/CE/059/2016).
5 Results
5.1 Sample
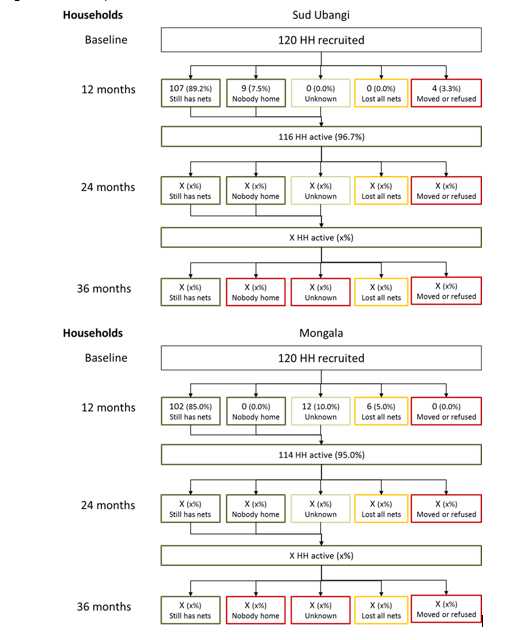
Out of the 240 households recruited in Sud Ubangi and Mongala at baseline 215 (89.6%) were interviewed at 12 months and this rate was identical at the two sites. As shown in Figure 2, the status of the households was very similar in Sud Ubangi and Mongala with 8-10% of households not available for interview. However, there were some challenges in Mongala in recording the reasons for non-availabilty and it could not be determined whether households were only temporarily unavailable or had moved away for good. Six interviewed households in Mongala (5%), but none in Sud Ubangi had lost all campaign nets they had possessed. This implies that 116 (97%) households in Sud Ubangi and 114 (95%9 in Mongala were still active at 12 months and will be revisited at the 24 months survey. There had been 754 campaign nets labeled and included in the follow-up cohort in Sud Ubangi and Mongala. Of these 500 (66.3%) were seen at 12 months and details of the status of the others is presented in detail in section 6.4 (durability).
Figure 2: Follow-up status of households recruited at baseline
5.2 Determinants of Durability
Factors that have previously been shown to be associated with net durability were explored; these can be divided into environmental factors, net handling, type of sleeping place and knowledge and attitudes towards nets and their care and repair. Factors immediately involving the sleeping place environment are shown in Table 2 and Figure 3. Overall the situation was similar at the 12-month follow-up compared to baseline, but there were some changes. The proportion of households reporting storing food in sleeping rooms increased in Sud Ubangi from 34% to 54% and in Mongala from 39% to 58% but neither difference was statistically significant. The difference between sites in ever cooking in the sleeping rooms increased and was now clearly significant (p=0.0002) with 47% of households in Sud Ubangi doing this at least sometimes compared to 18% in Mongala. The type of sleeping place changed slightly at both sites from baseline with more cohort nets now being used over mats rather than beds which is most likely an effect of increased use of the cohort nets (see Table 7).
Table 2: Household risk factors
| Variable and site | Baseline | 12 months | 24 months | 36 months |
| Sud Ubangi | N=120 | N=107 | ||
| Ever store food in sleeping room | 34.2 % | 54.2 % | ||
| Cook in sleeping room
never sometimes always |
74.2 % 13.3 % 12.5 % |
53.3 % 19.6 % 27.1 % |
||
| Rodents observed (last 6 m) | 85.8 % | 87.9 % | ||
| Mongala | N=120 | N=108 | ||
| Ever store food in sleeping room | 39.2 % | 58.3 % | ||
| Cook in sleeping room
never sometimes always |
79.2 % 20.8 % 0 % |
82.4 % 16.7 % 1.0 % |
||
| Rodents observed (last 6 m) | 93.3 % | 90.7 % |
Durability risk factors associated with net handling are shown in Table 3. As one would expect after one year, the proportion of cohort nets ever washed had increased from baseline reaching 71% in Sud Ubangi and 50% in Mongala, but without a significant change in wash frequency which remained at about 2 washes every six months. The other determinants in this group remained mostly unchanged from baseline showing very similar patterns at both sites including positive and negative aspects. Almost all nets that were hanging were hanging loose over the sleeping place rather than being folded or tied up. On the other hand, drying of washed nets almost never occurred on bushes or fences reducing risk of damage and few households used detergents for washing. Instead nets were dried outside on the ground or a line (Mongala) or inside (Sud Ubangi).
Figure 3: Main type of sleeping place for campaign nets if used
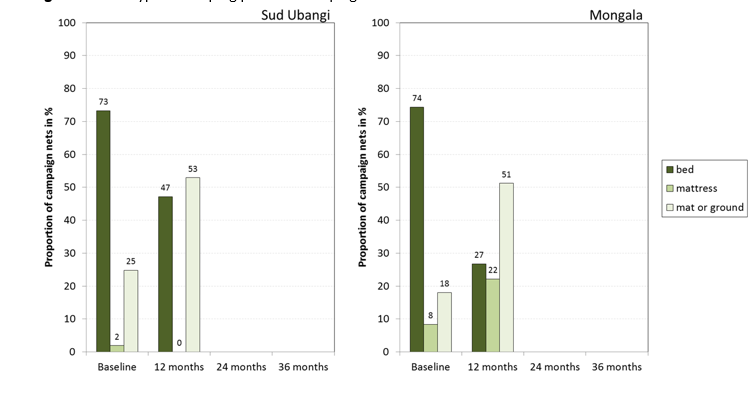
Table 3: Handling of campaign nets (IQR=Inter-Quartile-Range)
| Variable and site | Baseline | 12 months | 24 months | 36 months |
| Sud Ubangi | ||||
| Hanging nets NOT folded or tied | 95.6 % | 100 % | ||
| Net dried on fence or bush | 0 % | 3.1 % | ||
| Net ever washed | 7.2 % | 71.0 % | ||
| Median washed last 6 m (IQR) | 1.0 (1.0-2.0) | 2.0 (1.0- 3.0) | ||
| Used detergent/bleach for wash | 14.8 % | 21.4 % | ||
| Mongala | ||||
| Hanging nets NOT folded or tied | 99.0 % | 92.4 % | ||
| Net dried on fence or bush | 18.8 % | 5.3 % | ||
| Net ever washed | 4.2 % | 50.2 % | ||
| Median washed last 6 m (IQR) | 1.0 (1.0-1.0) | 2.0 (1.0- 3.0) | ||
| Used detergent/bleach for wash | 0 % | 22.6 % |
Exposure to net related messages, message recall, and the resulting household attitude towards care and repair are shown in Tables 4 and 5. At both sites exposure to messages had declined from baseline when the households still benefitted from the BCC activities associated with the campaign: exposure fell from 64% to 47% in Sud Ubangi and from 64% to 49% in Mongala. In both sites communication was almost exclusively through interpersonal communication and very few if any media exposure (Radio etc.).
In keeping with decreased exposure, message recall decreased for all messages in Sud Ubangi while recall was generally lower in Mongala, but did not decline that much from baseline. Interestingly, the care and repair attitude score increased at both sites in spite of lower exposure and message recall from 51% to 69% in Sud Ubangi and from 18% to 28% in Mongala suggesting that attitude is not so much dependent on recent BBC activities but might build more on multiple exposures over longer periods of time. It needs to be noted that in spite of similar exposure at both sites the positive attitude was significantly higher in Sud Ubangi compared to Mongala (p<0.0001). However, it must be kept in mind that the sample of households was smaller in the 12 months survey and that a certain “social desirability” bias cannot be excluded.
Table 4: Exposure to messages on nets in the last six months
| Variable and site | Baseline | 12 months | 24 months | 36 months |
| Sud Ubangi | ||||
| Any exposure last 6m | 64.2 % | 46.7 % | ||
| Mean info sources (if exposed) | 3.3 (1.9-4.6) | 1.5 (1.2-1.7) | ||
| Type of media
media only both IPC only |
0 % 2.6 % 97.4 % |
0 % 0 % 100 % |
||
| Mongala | ||||
| Any exposure last 6m | 64.2 % | 49.1 % | ||
| Mean info sources (if exposed) | 1.4 (1.2-1.6) | 1.6 (1.3-2.0) | ||
| Type of media
media only both IPC only |
32.9 % 17.1 % 50.0 % |
1.9 % 17.3 % 80.8 % |
Table 5: Recall of messages and attitude towards net care & repair (based on all surveyed households)
| Variable and site | Baseline | 12 months | 24 months | 36 months |
| Sud Ubangi | ||||
| Recalled “use net (every) night” | 64.2 % | 41.2 % | ||
| Recalled “nets prevent malaria” | 64.2 % | 29.9 % | ||
| Recalled “care for net” | 64.2 % | 43.9 % | ||
| Recalled “repair net” | 56.7 % | 33.6 % | ||
| Attitude score care and repair
mean (95% CI) % with score > 1.0 |
1.1 (0.9-1.3) 50.8 % |
1.2 (1.0-1.3) 69.2 % |
||
| Mongala | ||||
| Recalled “use net (every) night” | 35.0 % | 35.2 % | ||
| Recalled “nets prevent malaria” | 23.3 % | 9.3 % | ||
| Recalled “care for net” | 20.8 % | 28.7 % | ||
| Recalled “repair net” | 0.8 % | 1.9 % | ||
| Attitude score care and repair
mean (95% CI) % with score > 1.0 |
0.7 (0.5-0.8) 17.5 % |
0.7 (0.5-0.9) 27.8 % |
The final step then looks at the experiences with holes and their repair. As one would expect with increasing time since distribution, the proportion of households experiencing any holes in their nets increased now reaching 82% and 72% of households in Sud Ubangi and Mongala respectively. If repairs were done, they were done either by family members (68%) or by relatives (37%) and mainly by stitching (78%) with some using also knots (37%), but no patches. The actual repair of damaged campaign nets from the cohort was low to moderate with 4% in Sud Ubangi and 18% in Mongala.
Overall the determinants of net damage continue to be quite similar between the two sites and show an elevated risk of damage due to almost all nets hanging loose during the day and many used to cover mats or the ground. The one significant difference is the higher care and repair attitude in Sud Ubangi compared to Mongala.
Table 6: Household experience with care and repair of any nets and actual repairs made in damaged campaign nets (n.a. =not applicable)
| Variable and site | Baseline | 12 months | 24 months | 36 months |
| Sud Ubangi | ||||
| Ever experienced holes in net | 19.2 % | 82.2 % | ||
| Ever discussed care and repair | 58.3 % | 57.0 % | ||
| Ever repaired (if had holes) | 0 % | 8.0 % | ||
| Damaged campaign nets repaired | n.a. | 4.2 % | ||
| Mongala | ||||
| Ever experienced holes in net | 35.8 % | 72.2 % | ||
| Ever discussed care and repair | 46.7 % | 52.8 % | ||
| Ever repaired (if had holes) | 16.7 % | 15.4 % | ||
| Damaged campaign nets repaired | n.a. | 17.9 % |
5.3 Net Use and Ownership
This section looks at the use and ownership of the campaign net as well as other nets in the sampled households including where they were obtained and used and who used them.
There were two major changes in Sud Ubangi and Mongala at 12 months compared to baseline (Tables 7-9). First, nets from the campaign where now being used to a much higher degree and were no longer found in the packages as frequently. However, this phenomenon was seen more clearly in Sud Ubangi where the campaign nets hanging increased from 54% to 78% while campaign nets in the package decreased from 43% to 14% (p<0.05 for both). In contrast, the change was from 26% to 46% (p=0.2) and from 71% to 33% (p<0.05) respectively for Mongala. The proportion of campaign nets reported to have been used every night in the last week was similar to use the previous night which in turn was more or less identical with hanging suggesting that if nets were hanging they were also used regularly. Household respondents were asked about seasonality of net use and overwhelmingly stated that they use nets equally during rains and dryer weather at both sites: 97% in Sud Ubangi and 83% in Mongala.
Table 7: Hanging and use of campaign nets from cohort
| Variable | Baseline | 12 months | 24 months | 36 months |
| Sud Ubangi | N=377 | N=269 | ||
| Hanging | 54.4 % | 78.1 % | ||
| Taken down or stored | 2.9 % | 5.9 % | ||
| Still in package | 42.7 % | 13.8 % | ||
| Used last night | 53.6 % | 74.4 % | ||
| Used every night (last week) | 53.3 % | 71.4 % | ||
| Mongala | N=377 | N=231 | ||
| Hanging | 26.0 % | 45.5 % | ||
| Taken down or stored | 2.7 % | 9.9 % | ||
| Still in package | 70.8 % | 32.9 % | ||
| Used last night | 25.5 % | 45.9 % | ||
| Used every night (last week) | 25.5 % | 45.9 % |
The second significant change is that households owning nets from other sources used these less than before as shown in Table 8, in line with an increase of campaign net use described above. In Sud Ubangi other nets hanging decreased more than in Mongala from 82% to 53% compared to 81% to 63% and went along with an increase of other nets found still in the package changing from 15% to 39% in Sud Ubangi and from 3% to 16% in Mongala (neither statistically significant due to small numbers). This was mainly because more households in Sud Ubangi had received additional nets from other sources since the campaign, 42% compared to 33% in Mongala and more in Mongala had discarded older nets from other sources compared to Sud Ubangi where the overall number of other nets in the surveyed households increased while it remained about the same in Sud Ubangi. These findings overall suggest that households either discarded or gave away the older nets favoring the new campaign nets instead and that this happened to a higher degree in Mongala.
Table 8: Hanging and use of non-cohort nets
| Variable | Baseline | 12 months | 24 months | 36 months |
| Sud Ubangi | N=39 | N=59 | ||
| Hanging | 82.1 % | 52.5 % | ||
| Taken down or stored | 2.6 % | 6.8 % | ||
| Still in package | 15.4 % | 39.0 % | ||
| Used last night | 76.9 % | 52.5 % | ||
| Used every night (last week) | 76.9 % | 52.5 % | ||
| Mongala | N=78 | N=75 | ||
| Hanging | 80.8 % | 62.7 % | ||
| Taken down or stored | 0 % | 6.7 % | ||
| Still in package | 2.6 % | 16.0 % | ||
| Used last night | 79.5 % | 62.7 % | ||
| Used every night (last week) | 79.5 % | 61.3 % |
There was one household in Mongala that no longer owned any ITN or net so that ownership of any ITN now was 99.1% in Mongala while it remained at 100% in Sud Ubangi. The ownership of any nets from other sources (92% of which were confirmed as LLIN) was similar at both sites (Table 9) and the main change was a significant increase of the proportion of nets obtained from relatives or friends (p<0.05) which reached 22% at Sud Ubangi and 20% in Mongala confirming that there was a significant within-community exchange of nets.
Table 9: Ownership of non-campaign nets and where households obtained them
| Variable | Baseline | 12 months | 24 months | 36 months |
| Sud Ubangi | ||||
| Household has any other nets | 22.5 % | 41.1 % | ||
| Source public sector | 18.3 % | 23.4 % | ||
| Source other campaign* | 9.2 % | 0.9 % | ||
| Source private sector | 0.8 % | 0.9 % | ||
| Source family or friends | 3.3 % | 21.5 % | ||
| Mongala | ||||
| Household has any other nets | 39.2 % | 42.9 % | ||
| Source public sector | 29.2 % | 25.0 % | ||
| Source other campaign* | 17.5 % | 2.8 % | ||
| Source private sector | 10.8 % | 7.4 % | ||
| Source family or friends | 3.3 % | 20.4 % |
*Previous or subsequent to cohort campaign
Table 10: Net users of campaign cohort nets if net used
| Variable | Baseline | 12 months | 24 months | 36 months |
| Sud Ubangi | N=202 | N=200 | ||
| Children only* | 7.4 % | 8.0 % | ||
| Children + adults** | 59.4 % | 55.0 % | ||
| Adults only** | 33.2 % | 37.0 % | ||
| Mongala | N=102 | N=106 | ||
| Children only* | 10.8 % | 15.1 % | ||
| Children + adults** | 32.4 % | 57.6 % | ||
| Adults only** | 56.9 % | 27.4 % |
* Age 0-9 years; ** includes adolescents 10-19
Table 11: Net users of non-cohort nets (n.a. =not applicable)
| Variable | Baseline | 12 months | 24 months | 36 months |
| Sud Ubangi | N=30 | N=31 | ||
| Children only* | 16.7 % | 12.9 % | ||
| Children + adults** | 50.0 % | 54.9 % | ||
| Adults only** | 33.3 % | 32.3 % | ||
| Mongala | N=65 | N=47 | ||
| Children only* | 15.4 % | 4.3 % | ||
| Children + adults** | 23.1 % | 55.3 % | ||
| Adults only** | 61.5 % | 40.4 % |
* Age 0-9 years; ** includes adolescents 10-19
The use pattern of cohort nets from the campaign as well as non-cohort nets was similar in both sites and did not change significantly from baseline as shown in Tables 10 and 11.
5.4 Durability of campaign nets
The status of the campaign nets for the durability cohort after 12 months is shown in Figures 4-5. Of the 377 nets labeled in Sud Ubangi, 269 (71%) were found to be present, 29 (8%) were used by the families at a different location (school or farm) and for 30 nets (8%) the current status was unknown because the household could not be interviewed during this survey round. The number of cohort nets definitely lost to follow-up was 49 (13%) leaving 328 (87%) of the initially labeled nets still active.
Figure 4: Status of cohort nets recruited at baseline in Sud Ubangi Province
In Mongala 231 out of the 377 campaign nets (61%) were present, 23 (6%) were used by the family at other locations and for 32 (9%) the current status was unknown. A total of 91 campaign nets (24%) had been lost to follow up for various reasons (see Figure 5) leaving 286 or 76% active for follow-up at the 24-month survey.
Figure 5: Status of cohort nets recruited at baseline in Mongala Province
Table 12: Attrition since distribution (including nets lost between campaign and baseline)
| Variable | Campaign – baseline | Campaign –
12 months |
Campaign –
24 months |
Campaign –
36 months |
| Sud Ubangi | N=409 | N=340 | ||
| Given away | 7.6 % | 16.2 % | ||
| Discarded (wear & tear) | 0.2 % | 1.5 % | ||
| Unknown | 0.0 % | 3.2 % | ||
| Total | 7.8 % | 20.9 % | ||
| Mongala | N=394 | N=345 | ||
| Given away | 4.3 % | 13.6 % | ||
| Discarded (wear & tear) | 0 % | 10.1 % | ||
| Unknown | 0.0 % | 9.3 % | ||
| Total | 4.3 % | 33.0 % |
The resulting all-cause attrition rates and losses due to wear and tear since the campaign are shown in Table 12 and Figure 7[3]. In Sud Ubangi all-cause attrition moderately increased from 8% to 16%, but only 1% (four nets) were lost due to wear and tear. In Mongala the situation was quite different with all-cause attrition increasing five-fold, from 6% to 33%, but here 38% of losses were due to wear and tear. This difference between sites was statistically significant (p=0.009). Of the 35 nets discarded in Mongala to wear and tear eight were accidentally destroyed, 26 were thrown away because they were perceived as too damaged and only one was used for other purposes, i.e. it was cut up to serve for various other purposes.
Figure 7: Trends in all cause attrition and wear and tear (discarded nets) as a function of time since distribution
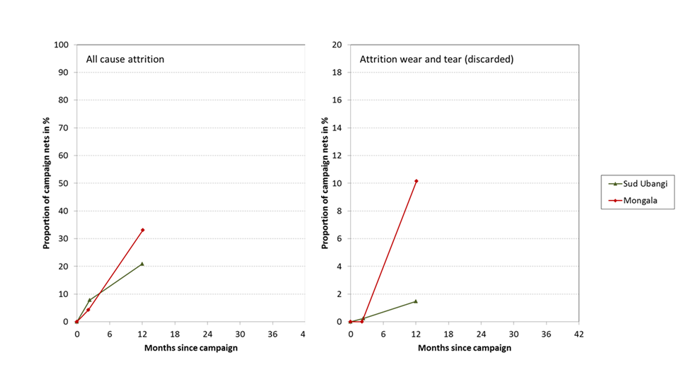
Table 13: Physical condition (integrity) of surviving cohort nets (pHI=proportionate Hole Index)
| Variable | Baseline | 12 months | 24 months | 36 months |
| Sud Ubangi | N=377 | N=269 | ||
| Any holes | 9.3 % | 61.3 % | ||
| Median pHI (if any hole) | 23 | 49 | ||
| Good (pHI<64) | 98.9 % | 72.9 % | ||
| Too torn (pHI>642) | 0 % | 9.7 % | ||
| Serviceable (pHI≤642) | 100 % | 90.3 % | ||
| Mongala | N=377 | N=231 | ||
| Any holes | 10.6 % | 45.9 % | ||
| Median pHI (if any hole) | 48 | 466 | ||
| Good (pHI<64) | 96.3 % | 66.2 % | ||
| Too torn (pHI>642) | 1.1 % | 19.9 % | ||
| Serviceable (pHI≤642) | 98.9 % | 80.1 % |
As one would expect, the proportion of nets still present in the surveyed households with any sign of damage increased significantly from baseline to the 12-month follow-up: from 9% to 61% in Sud Ubangi and from 11% to 36% in Mongala. At both sites the majority of nets, were still in good condition with 73% and 66% respectively, but the proportion too torn to be useful differed significantly between the two sites with 10% in Sud Ubangi and 20% in Mongala (p=0.03). This difference is also seen in the higher hole index value for the damaged nets (49 vs. 466) and resulted in a 10%-point difference in the proportion of campaign nets in serviceable condition, Sud Ubangi 90%, Mongala 80% (p=0.03).
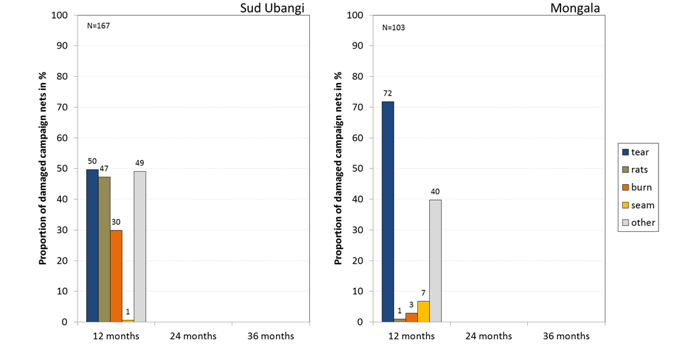
The type of damage mechanisms reported by the households for each campaign net with any holes is shown in Figure 8. Because at baseline the number of nets with any damage was too small there is no direct comparison with the 12-months results, but the damage pattern is similar to what households reported in general about their experience with damage mechanisms at baseline (not net specific): Mechanical damage was the most common type of damage, rodent and burns were less common, but were significantly more often reported in Sud Ubangi than in Mongala. There was also a considerable proportion of “other” mechanisms of damage reported at both sites.
Figure 8: Type of damage mechanisms reported for damaged campaign nets (multiple responses)
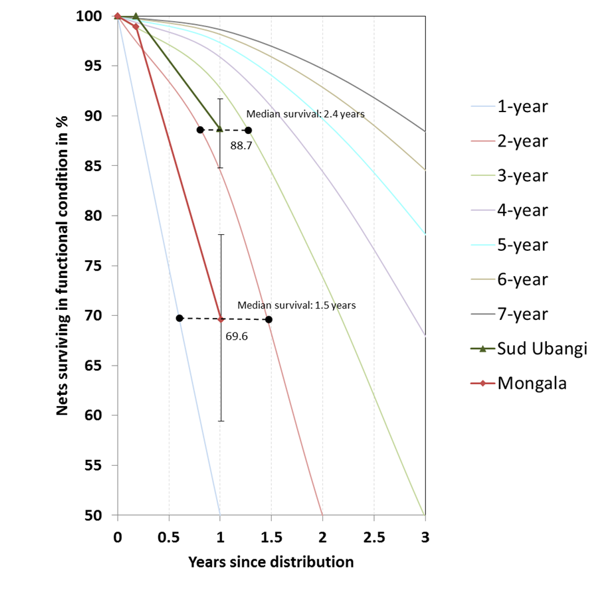
Overall physical survival in serviceable condition after 12 months, i.e. the combination of attrition due to wear and tear and the integrity of the still existing nets, was 88.7% in Sud Ubangi where Duranet had been distributed and 69.6% in Mongala with Dawa Plus (Table 14). The difference was statistically highly significant in the Pearson’s design-based F test (p=0.0001). Both these results are below the expected mark for a “three-year” survival which would be 93% after 12 months. When these results are plotted against the hypothetical survival curves with defined median survival (Figure 9) the median survival time at Sud Ubangi can be projected to be 2.4 years while that for Mongala only 1.5 years[4], i.e. half of what would have been expected.
Considering only campaign nets that had ever been used (taken out of the package) reduces the survival estimate for Sud Ubangi by a moderate 1.8%-points to 86.9% but that for Mongala reduces by another 12.2%-points to 57.4% which is equivalent to a median survival time of only 1.2 years.
Table 14: Nets surviving in serviceable condition (including nets discarded before baseline)
| Variable | Baseline | 12 months | 24 months | 36 months |
| Sud Ubangi | N=377 | N=274 | ||
| Survival estimate | 100 % | 88.7 % | ||
| 95% CI | – . – | 84.8 – 91.7 | ||
| Only nets ever used | N=340 | N=237 | ||
| Survival estimate | 100 % | 86.9 % | ||
| 95% CI | – . – | 82.4 – 90.4 | ||
| Mongala | N=377 | N=266 | ||
| Survival estimate | 98.9 % | 69.6 % | ||
| 95% CI | 96.7 – 99.7 | 59.5 – 78.1 | ||
| Only nets ever used | N=301 | N=190 | ||
| Survival estimate | 98.7 % | 57.4 % | ||
| 95% CI | 96.1 – 99.6 | 49.1 – 65.3 |
Figure 9: Estimated net survival in serviceable condition with 95% confidence intervals (error bars) plotted against hypothetical survival curves with defined median survival.
5.5 Insecticidal effectiveness of campaign nets
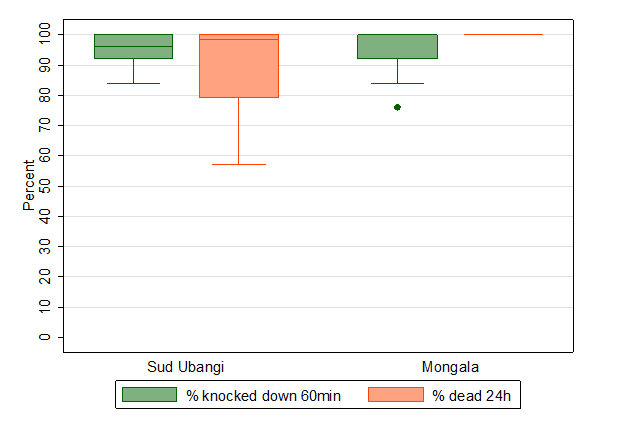
Results from bio-assays of the 30 campaign nets sampled at each site are shown in Table 15 and Figure 10. The samples collected at 12-months in Sud Ubangi and Mongala both showed sufficient insecticidal effectiveness with 83% of tested nets fulfilling WHOPES criteria for optimal effectiveness in Sud Ubangi (Duranet) and 100% in Mongala (Dawa Plus 2.0). However, the five nets in Sud Ubangi that were below the cut-off of optimal performance missed the target values by only 2 or 3 5-points. All five nets had reportedly been used daily the past week and no association of bio-assay performance with wash frequency or type of soap was seen.
Table 15: Results from bio-assays
| Variable | 12 months | 24 months | 36 months |
| Sud Ubangi | N=30 | ||
| Knock down 60 minutes
Mean (95% CI) Median (IQR) |
95.6% (93.5-97.6) 96.0% (92.0-100 ) |
||
| Mortality 24 hours
Mean (95% CI) Median (IQR) |
89.6% (82.9-96.3) 98.5% (79.0-100) |
||
| Optimal effectiveness
Estimate (95% CI) |
83.3% (63.4-93.5) |
||
| Minimal effectiveness
Estimate (95% CI) |
100% (-.-) |
||
| Mongala | N=30 | ||
| Knock down 60 minutes
Mean (95% CI) Median (IQR) |
95.5% (92.7-98.2) 100% (92.0-100 ) |
||
| Mortality 24 hours
Mean (95% CI) Median (IQR) |
100% (-.-) 100% (-.-) |
||
| Optimal effectiveness
Estimate (95% CI) |
100% (-. -) |
||
| Minimal effectiveness
Estimate (95% CI) |
100% (-. -) |
Figure 10: Results from WHO cone bio-assays: the box plot shows the median (horizontal line), Inter-Quartile-Range (box), adjacent values[5] (whiskers) and outliers (circles)
Tables 16-18 then show the details of handling and use of the sampled bio-assay nets. All had been hung and almost all had been used the previous night in Sud Ubangi and Mongala. As had been seen for the cohort nets, most nets were hanging loose rather than tied up and about half the nets were used over bed frames. Washing frequency was similar at both sites with about two washed per six months or four per year, and after 12 months almost all nets had been washed at least once. Overall the results for the bio-assay nets are comparable to those for the cohort nets suggesting that the bio-assay samples were a good representation of the campaign nets under study.
Table 16: Variables related to handling of bio-assay test nets
| Variable | 12 months | 24 months | 36 months |
| Sud Ubangi | N=30 | ||
| Location found
hanging loose hanging folded/tied |
97 % 3 % |
||
| Type of sleeping place
bed mattress mat/ground |
53 % 3 % 43 % |
||
| Net users
young child only young child + adult older child, adult only |
20 % 37 % 43 % |
||
| Mongala | N=30 | ||
| Location found
hanging loose hanging folded/tied |
87 % 13 % |
||
| Type of sleeping place
bed mattress mat/ground |
57 % 17 % 27 % |
||
| Net users
young child only young child + adult older child, adult only |
17 % 27 % 57 % |
Table 17: Variables related to use of bio-assay test nets
| Variable | 12 months | 24 months | 36 months |
| Sud Ubangi | N=30 | ||
| Used last night | 93 % | ||
| Use last week
every night most nights(5-6) some nights(1-4) not used don’t know |
93 % 0 % 0 % 3 % 3 % |
||
| Seasonal use
equally rain and dry mainly rain rain only |
100 % 0 % 0 % |
||
| Mongala | N=30 | ||
| Used last night | 87 % | ||
| Use last week
every night most nights(5-6) some nights (1-4) not used don’t know |
83 % 3 % 3 % 10 % 0 % |
||
| Seasonal use
equally rain and dry mainly rain rain only |
93 % 7 % 0 % |
Table 18: Variables related to washing of bio-assay test nets
| Variable | 12 months | 24 months | 36 months |
| Sud Ubangi | N=30 | ||
| Ever washed | 93 % | ||
| Washes last 6 month (all)
Mean Median |
2.0 (1.3-2.6) 2.0 (1.0-3.0) |
||
| Washes last 6 month (if washed)
Mean Median |
2.1 (1.6-2.7) 2.0 (1.0-3.0) |
||
| Soap used
country soap bar detergent or bleach mix |
72 % 21 % 7 % |
||
| Mongala | N=30 | ||
| Ever washed | 87 % | ||
| Washes last 6 month (all)
Mean Median |
1.8 (1.2-2.3) 2.0 (1.0-2.0) |
||
| Washes last 6 month (if washed)
Mean Median |
2.0 (1.5-2.5) 2.0 (1.0-2.0) |
||
| Soap used
country soap bar detergent or bleach mix |
53 % 30 % 17 % |
6 Summary and Conclusion
This report presents the findings of the 12-month follow-up assessment for a three year durability monitoring study of two brands of LLINs, Duranet and Dawa Plus 2.0, distributed through mass campaigns in two locations of northern DRC with very similar ecological, demographic and behavioral environments, Sud Ubangi Province (Ndege Health Zone) and Mongala Province (Binga Health Zone).
House and net follow-up
Tracking down the households recruited at baseline generally went very well with 89% of the 120 households interviewed in Sud Ubangi and 85% of 120 in Mongala. In Sud Ubangi four households were lost as the family moved away and nine households (8%) were temporarily unavailable but will be included in the next survey round. In Mongala 12 households were not found for interview but the details of the reasons were not recorded. Of the campaign nets labeled for the durability monitoring cohort 328 (87%) are still active in Sud Ubangi and 286 (76%) in Mongala. These rates of follow-up can be considered as excellent and within the expected.
Durability risk factors
Overall the durability risk factors based on sleeping place environment, net handling and household knowledge and attitudes were very similar to what had been found at baseline but with some differences between the two sites. Net handling was poor in that at both sites nets were always left hanging loose during the day when they were hanging at all. Net washing risk was moderate, with no apparent use of detergents or drying of LLINs on fences or bushes. BCC exposure was not very high at both sites, had declined since the baseline and consisted predominantly of interpersonal communication. However, recall of messages was better in Sud Ubangi than Mongala and although recall declined somewhat, the proportion of households with a very positive net care and repair attitude had increased from baseline and was significantly better in Sud Ubangi than Mongala (69% vs. 28%).
Net use and ownership
At baseline – two months after distribution – there had been some concerns that the majority of campaign cohort nets were found still in the package (43% in Sud Ubangi and 71% in Mongala). Ten months later, i.e. one year after distribution the situation had changed significantly with only 14% and 33% of cohort nets still in the package, 78% and 54% respectively hanging and 77% and 54% used the previous night. On the other hand, nets from other sources were now used less, especially in Sud Ubangi where nets obtained since the campaign were now more likely to be kept in the package. There was some evidence of between-household shift of nets as 22% and 20% respectively had nets from “relatives or friends” and this rate had increased from baseline. In Sud Ubangi 42% of households had received additional nets since the campaign and half came from public sector distribution (through ANC) while in Mongala the rate was 33% and slightly more than half coming from the public sector (ANC and health facilities) while the other half was from relatives.
Integrity outcomes
After one year about half of the campaign nets still found in the homes and inspected for damage were found to have any holes (61% Sud Ubangi, 46% Mongala). But although the rate of any holes was lower in Mongala, the level of damage was higher with 20% of surviving nets being too torn compared to only 10% in Sud Ubangi. In line with this finding there also was a statistically significant difference in the rate of attrition due to wear and tear which was 1.2% in Sud Ubangi, but 10.1% in Mongala. Although some caution has to be applied when projecting the expected median survival time at this early stage, the median expected survival of campaign nets in Sud Ubangi is 2.4 years and that for Mongala even lower at 1.5 years. Both results are below the expected three year survival estimate and the difference between the sites is also statistically significant. Although the design of this study is primarily to compare two different brands in similar environments, the observed difference cannot entirely be attributed to the brands as at the better performing site (Sud Ubangi) there also was a significantly better net care and repair attitude.
Insecticidal effectiveness
The insecticidal effectiveness was good at both sites with 83% (Sud Ubangi) and 100% (Mongala) of tested samples fulfilling WHOPES criteria of optimal insecticidal performance. Results for the Duranet in Sud Ubangi were slightly but not statistically significantly lower than Dawa Plus 2.0 in Mongala. The nets sampled for bio-assays were comparable to the cohort nets with respect to handling and washing.
In conclusion it can be said that the follow-up of the durability monitoring cohort in Sud Ubangi and Mongala was successful, but that the physical durability results are slightly below the expected range in Sud Ubangi (Duranet), and significantly below the “three year” standard in Mongala (Dawa Plus 2.0). The difference was in a higher proportion of campaign nets in Mongala lost to wear and tear as well as a poorer condition of the surviving nets. The evidence to date suggests that the poorer performance of the LLIN product in Mongala could in part be due to differences in the textile characteristics of the brands tested under generally harsh and difficult conditions, but that some behavioral differences in attitude between the sites also contributed to the observed difference in performance. At this point there is no immediate recommendation to be made regarding net procurement, but BCC related to net care and repair should be enhanced, especially in Mongala Province.
The insecticidal effectiveness was good at both sites with >80% of tested samples fulfilling WHOPES criteria of optimal insecticidal performance. Results for the Duranet in Sud Ubangi were slightly but not statistically significantly lower than Dawa Plus 2.0 in Mongala. The nets sampled for bio-assays were comparable to the cohort nets with respect to handling and washing.
[1] Kilian A, Byamukama W, Pigeon O, Gimnig J, Atieli F, Koekemoer L, Protopopoff N: Evidence for a useful life of more than three years for a polyester-based long-lasting insecticidal mosquito net in Western Uganda. Malar J 2011, 10:299
[2] Kilian A, Koenker H, Obi E, Selby RA, Fotheringham M, Lynch M: Field durability of the same type of long-lasting insecticidal net varies between regions in Nigeria due to differences in household behaviour and living conditions. Malar J, 2015,14:123
[3] Figure 6 is reserved for the flow chart of follow-up in countries with three DM sites and is omitted here to allow consistency of Figure numbers across country DM reports.
[4] The figure is obtained by estimating the relative position of the 12 months data point on a horizontal line between the two adjacent median survival curves as shown in Figure 9.
[5] Adjacent values: +/- 1.5 * Inter-Quartile-Range